1
2
3
4
5
6
7
8
9
10
11
12
13
14
15
16
17
18
19
20
21
22
23
24
25
26
27
28
29
30
31
32
33
34
35
36
37
38
39
40
41
42
43
44
45
46
47
48
49
50
51
52
53
54
55
56
57
58
59
60
| import matplotlib.pyplot as plt
import numpy as np
import random
from PIL import Image
import glob
import os
EEG_LENGTH = 150
IMAGE_TIME = 90
class Show:
def get_file_path(self):
image_type = ['cat', 'dog']
dir_path = os.path.join(os.path.abspath('.'), 'image')
image_list = []
for type in image_type:
dir_image_path = os.path.join(dir_path, type) + '\*.jpg'
image_files = glob.glob(dir_image_path)
for image in image_files:
image_list.append(type + '|' + image)
return image_list
def get_data(self):
return np.random.random()
def show_picture(self, image_list):
l = len(image_list)
plt.ion()
figure = plt.figure(figsize=(10, 5))
fig1 = figure.add_subplot(1, 2, 1)
fig2 = figure.add_subplot(1, 2, 2)
data = []
i = 0
x = np.linspace(0, 2, EEG_LENGTH)
while i < l:
if len(data) < EEG_LENGTH:
single_data = self.get_data()
data.append(single_data)
if len(data) == EEG_LENGTH:
for j in range(IMAGE_TIME):
fig2.cla()
fig2.plot(x, data)
data = data[1:]
single_data = self.get_data()
data.append(single_data)
img = Image.open(image_list[i].split('|')[1])
fig1.imshow(img)
plt.xticks([])
plt.yticks([])
plt.pause(0.000001)
fig1.cla()
if j == IMAGE_TIME - 1:
i += 1
if __name__ == '__main__':
show = Show()
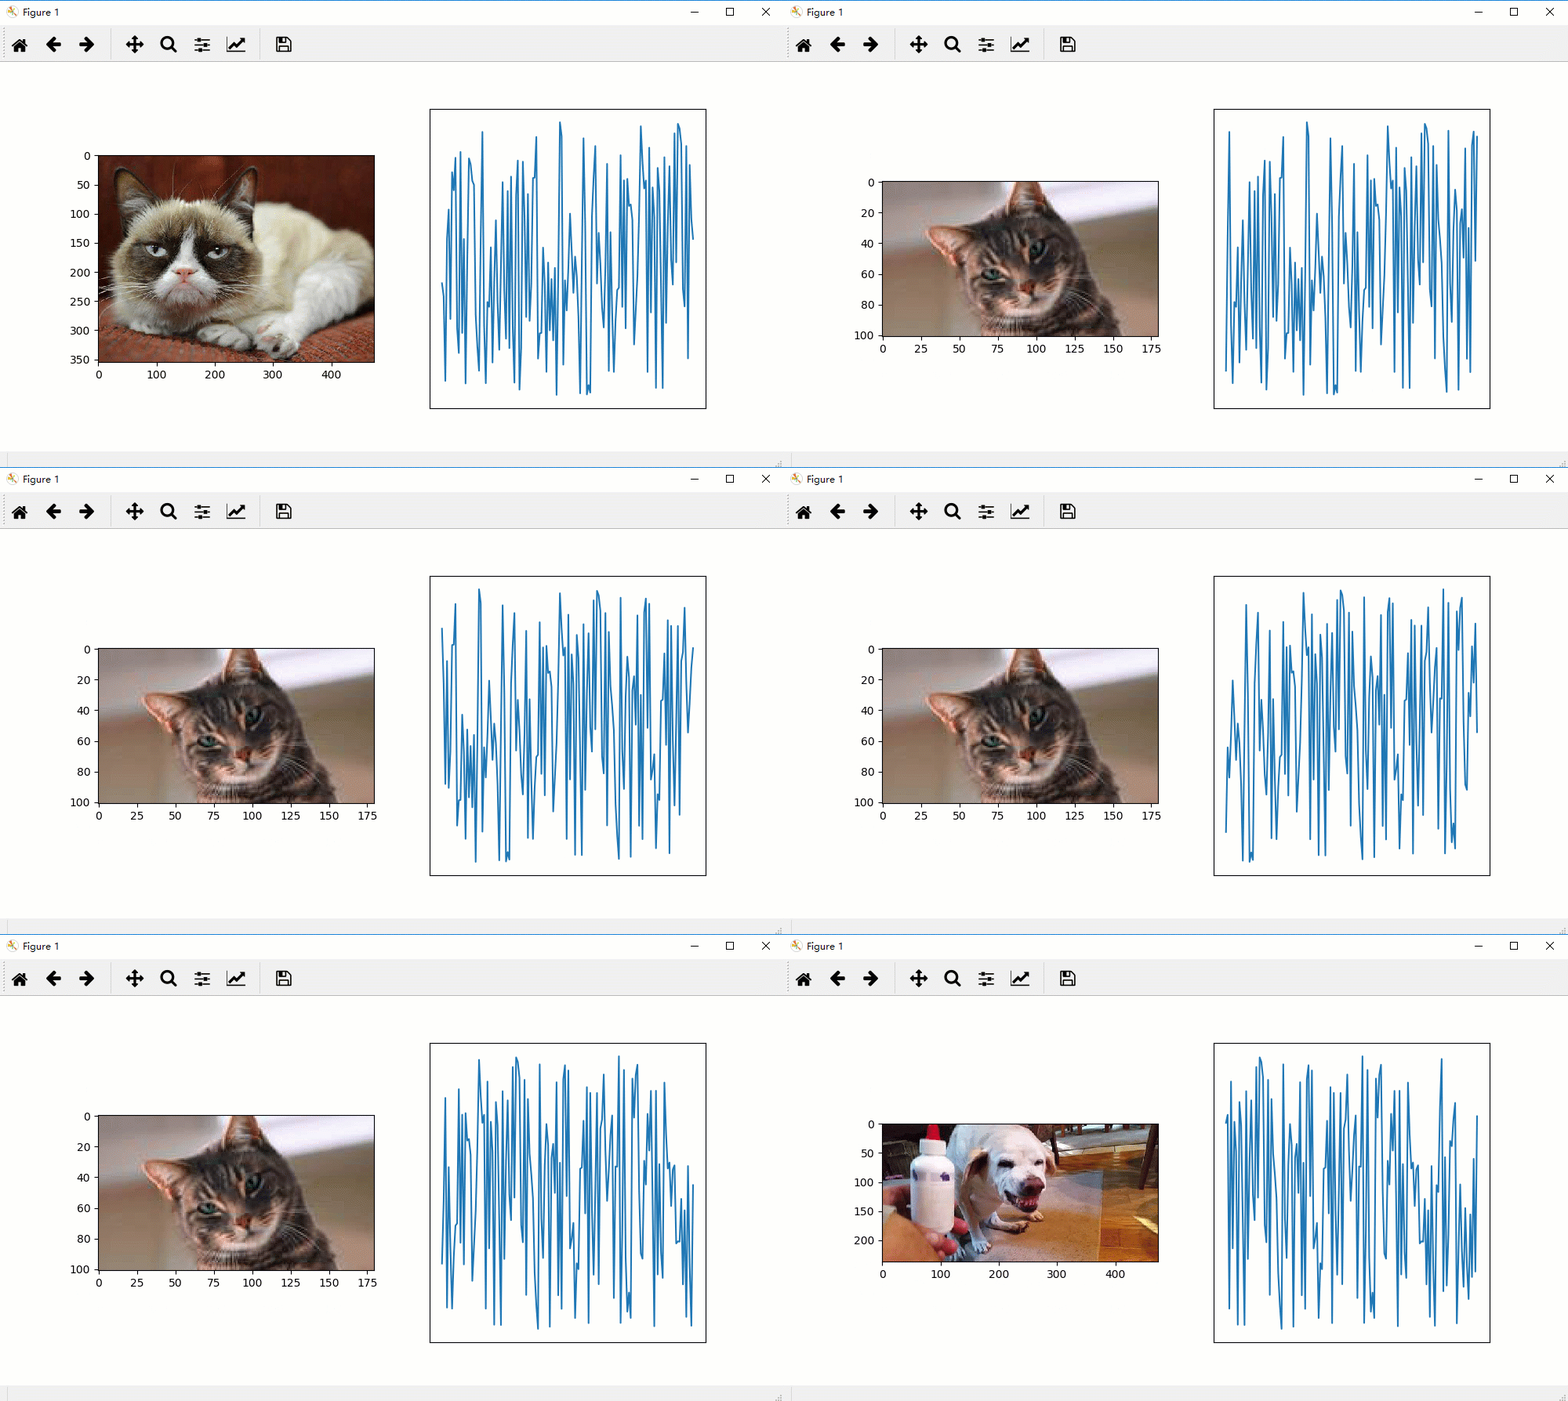
show.show_picture(show.get_file_path())
|

